site update
I decided to update the theme of my blog to a classic weblog format. The new theme is heavily inspired by jwz.org and simonwillison.net.
Subscribe to this stream: RSS feed
I decided to update the theme of my blog to a classic weblog format. The new theme is heavily inspired by jwz.org and simonwillison.net.
Since the v1.0.0 release of the new MySQL Operator (K8SPS), point-in-time recovery (PiTR) has been the most anticipated feature. Naturally, we decided to implement it in the upcoming v1.1.0 release.
PiTR relies on two processes:
Our Galera replication-based MySQL Operator (K8SPXC) has a binary log collector that was developed by the Cloud Team. It has worked reliably for years but has a certain limitation that is inherent in its design: it depends on flushing the binary logs to collect them. This leads to huge numbers of binary logs on the MySQL server, which becomes a headache after running the collector for a few weeks. We mitigated this for the users by maintaining a cache for binary logs, but it didn’t remove the pain—it just became ours.
At Percona, #FindABetterWay is one of our core values. In the spirit of finding a better way, when we first started to think about PiTR in K8SPS, we decided to improve the process of collecting binary logs. These discussions eventually led to the birth of a new product: Percona Binlog Server (PBS).
PBS works by connecting to the MySQL server as a replica and streaming events. It either uploads these events to S3 or stores them on the filesystem. It supports replication source switchovers and is able to continue from where it left off. On top of these, it provides helper commands to search for a particular GTID or timestamp in the collected binary logs.
The official MySQL docs suggest converting each binary log to text using mysqlbinlog and piping them into the mysql client for PiTR. This is already what we do in K8SPXC.
I decided to check if there’s a better way. First, I checked old posts on the Percona Blog to see if our experts had written anything about a different PiTR approach. It’s not surprising that they did. Marcelo wrote about an approach leveraging replication appliers for recovery. It seemed much better than piping mysqlbinlog output into the client, since with replication we can have multithreading and parallel appliers for recovery. My only problem with this approach was that it required two mysqld instances. Of course it’s possible, but I would love to not have to care about the state of two MySQL servers.
Luckily, lefred commented that there’s an “even better” approach that requires only one MySQL server!
At a high level, the process looks like this:
mysqld instanceCHANGE REPLICATION SOURCE TO RELAY_LOG_FILE=..., SOURCE_HOST='dummy'START REPLICA SQL_THREAD UNTIL <GTID>STOP REPLICA; RESET REPLICA ALL;I have already created an unpolished but working PoC. There is also an RFC for explaining various decisions and tracking open questions that need answers. There’s still work to do, but I’m confident that this approach is good and we’ll release this as a tech preview in the upcoming v1.1.0 release. If you have thoughts on the RFC or want to try the PoC, we’d love to hear your feedback.
My talk at the Cloud‑Native Databases Conference is finally live!
We are in the process of certifying our operators for <redacted>. We started
with PostgreSQL Operator and it worked just fine without any adjustments. Then
we moved on to our MySQL Operators and it surfaced a problem in HAProxy.
HAProxy is used by default in our MySQL clusters. They sit in front of MySQL instances as the proxy to have read/write splitting. We have our own external scripts to perform checks for each backend for determining if a MySQL server is good for that particular backend.
After deploying the operator on <redacted>, we realized that our HAProxy pods are
failing to get ready because all external checks are failing due to timeouts.
But why?
It’s gotta be the DNS. It’s always DNS, isn’t it? Turns out, no. I tested DNS queries from the HAProxy container and it seems they were fast.
Could this be AppArmor? Maybe <redacted> has stricter AppArmor profiles? I configured
HAProxy pods to be Unconfined. It didn’t help either.
Then I decided to increase the timeout from 10 seconds to 30 seconds, just to see how much time the script needs to finish. To my surprise, the script was taking 810 milliseconds to finish! How could a check time out in 10 seconds but finish in less than a second with 30 seconds timeout?
In every deep debugging session, there is a moment when engineers start to believe in spiritual beings or gremlins who mess with the software in the system. One needs to resist this temptation of irrationality. In computers there’s always a rational explanation for problems, it’s just very deep and caused by unlucky combinations of design choices and/or bugs.
At this point I decided to attach a debug container into the pod and check what HAProxy is doing with strace. This resulted in the first breakthrough of the problem: the child process of HAProxy that runs the external check command was doing shitloads of poll syscalls until it was killed due to timeout. It wasn’t even running the script, it was simply stuck.
This realization made me shift my focus to HAProxy itself. I started to read the source code to see what’s going on.
int fd;
sa_family_t family;

/* close all FDs. Keep stdin/stdout/stderr in verbose mode */
fd = (global.mode & (MODE_QUIET|MODE_VERBOSE)) == MODE_QUIET ? 0 : 3;

my_closefrom(fd);

/* restore the initial FD limits */
limit.rlim_cur = rlim_fd_cur_at_boot;
limit.rlim_max = rlim_fd_max_at_boot;
if (raise_rlim_nofile(NULL, &limit) != 0) {
	getrlimit(RLIMIT_NOFILE, &limit);
	ha_warning("External check: failed to restore initial FD limits (cur=%u max=%u), using cur=%u max=%u\n",
		   rlim_fd_cur_at_boot, rlim_fd_max_at_boot,
		   (unsigned int)limit.rlim_cur, (unsigned int)limit.rlim_max);
}
HAProxy attempts to close all FDs. What does all mean? And then it restores limits to some value? What’s that value?
All FDs means closing all from FD 0 to FD soft limit. my_closefrom function
first polls the FD and then closes it if poll doesn’t fail with POLLNVAL. OK,
this explains the excessive polling I see with strace. But it’s the default
HAProxy behavior for a long time, why didn’t we see the same problem on some
other platform, i.e GKE?
The answer is simple. Turns out, <redacted> has a much higher soft limit than GKE. On
GKE ulimit -n returns 1048576, on <redacted> 1073741816! But still there was
something that troubled me at this point: I vaguely remembered a configuration
option in HAProxy that limits the number of FDs that the process will use. The
option is fd-hard-limit and
docs say its
default value is 1048576. If it had any effect, I wouldn’t have seen any
problems. Something was wrong in HAProxy.
Remember that the external check process was doing something to restore limits
to some value assigned at boot? Those values are assigned in the main
function here:
/* take a copy of initial limits before we possibly change them */
getrlimit(RLIMIT_NOFILE, &limit);

if (limit.rlim_max == RLIM_INFINITY)
	limit.rlim_max = limit.rlim_cur;
rlim_fd_cur_at_boot = limit.rlim_cur;
rlim_fd_max_at_boot = limit.rlim_max;
The
code
that limits FDs with fd-hard-limit is a few lines below:
if (global.fd_hard_limit && limit.rlim_cur > global.fd_hard_limit)
	limit.rlim_cur = global.fd_hard_limit;
This means external checks restore limits to the value unbounded by
fd-hard-limit. Oh, this looks like a
bug in HAProxy and explains
why we had this issue!
I’m a self-taught engineer. While molding myself into an engineer, I haven’t had the chance to have mentors or even peers that I can talk and learn from. At the beginning of my journey I was alone trying to figure things out from first principles. As a substitute I turned to prominent figures on the internet who were sharing their thoughts in public.
They shaped my views on technology and engineering a lot. They were all women. Following these people was not a deliberate decision. I definitely didn’t choose them just because they are women. I wasn’t even aware that I’d picked them as my role models. I only understood that I did retrospectively.
When I first encountered Julia’s blog, she was working at Stripe. She was the one who inspired me to start writing on my blog. Her attitude towards learning in public and doing experiments with the computer was deeply influential for me.
I think Jessie was still working at Microsoft when I first started reading her posts. I was always fascinated with containers—first because I didn’t understand how they work and then because I understood—and she was the container queen. I still think of her when I use the term “hacker.”
I don’t know who Rachel really is but her writing was very influential in my career. Her technical depth is unmatched. I think she alone taught me not to cut corners and care about the reliability of my code. She’s still writing on her blog but my stupid RSS reader is unable to conform to her rules so I can’t regularly read her writings.
I think Charity was about to found Honeycomb when I started following her. That’s probably why I learned more about the people side of things from her than the technical. Nevertheless, her thoughts were immensely important for me since I was forced to assume leadership positions so early in my career.
These four women were my role models and they shaped me a lot even though I’ve never met them. After nine years in my career, I still think about them.
Happy International Women’s Day to all women around the world!
This week, just like the previous, was filled with PostgreSQL (PG). I’m still working on v2.9.0 release of the PG operator.
Last week I merged the implementation of pg_tde to bring data-at-rest encryption to Kubernetes. Then we started doing QA: oh boy, did it ever surface problems!
One of the goals of v2.9.0 is declaring major version upgrades production-ready. So we decided to test the upgrade with TDE enabled. Boom, data corruption. Point-in-time recovery is problematic, pg_rewind too…
This is one of my favorite things about Kubernetes. You put something fragile on it and watch it shatter. Of course I need to give credit to our QA engineers: they don’t stop until they watch the software crumbling in pain.
Outside of PG stuff, I opened a small PR for adding volume mount information to kubectl-status plugin. I needed to quickly check mounts for a few containers while testing PG major upgrades and did a quick implementation with Claude. Before opening the PR, I was unsure whether I should mention that the code was written by Claude. I still feel embarrassed about using AI code generation. In the end I decided to openly admit it because it’s the right thing to do. I also want our contributors to be open about their usage of AI (I know they use AI).
Speaking of AI code generation, I feel that the vibe has shifted significantly. I see the pessimists have accepted defeat and I am one of them: AI can write code and the code is not crap. It’s not 2023 anymore and it looks like it’s time to update my priors. I am trying to integrate Claude Code into my workflows and I had a bunch of positive interactions with it the last few weeks. I am also coding a big feature using Claude just for the sake of the experience.
The Percona team is heading to KubeCon + CloudNativeCon Europe in Amsterdam, and I’d love to meet you in person!
You can find me at Booth 790. This is a great chance to talk with me and other engineers working on Percona Operators.
We will be there to discuss:
If you’re already running Percona Operators in production (or just getting started), I’d love to hear your feedback and learn about the challenges you’re facing. And if you’re just curious—or even a little suspicious—about running databases on Kubernetes, come by! I’d love to answer your questions and share our perspective.
We have a 20% discount code available for Percona community members. If you’re planning to attend and don’t have a ticket yet, let me know and I’ll send the code your way.
If you’d like to carve out some dedicated time to talk, let’s schedule a meeting or grab a coffee together. You can reach out to me directly at ege.gunes [at] percona [dot] com.
See you in Amsterdam!
The upcoming Percona Operator for PostgreSQL v2.6.0 release introduces support for PostgreSQL 17, which opens exciting possibilities for data security. Since pg_tde comes pre-installed in Percona’s official PostgreSQL 17 images, this release presents an excellent opportunity to implement Transparent Data Encryption in your Kubernetes-deployed databases. Let’s look at how to configure and use pg_tde with the Percona PostgreSQL Operator.
Transparent Data Encryption (TDE) offers encryption at the table level and solves the problem of protecting data at rest. The Percona Distribution for PostgreSQL currently offers the only open source implementation of TDE for PostgreSQL. The encryption is transparent for users, allowing them to access and manipulate the data without requiring application modifications.
While pg_tde has a build available for PostgreSQL Community Server, the extension leverages extended APIs introduced in Percona Server for PostgreSQL to provide more complete and performant encryption. You can read more about the pg_tde extension in the TDE beta announcement blog post.
The new Percona Operator release will include pg_tde pre-installed with PostgreSQL 17, simplifying the implementation of encryption at rest. Note: Currently, pg_tde is in the beta phase. Please try it out on non-production setups and share your feedback!
To begin, we need to configure PostgreSQL to load pg_tde during startup. This configuration is managed through the deploy/cr.yaml file:
patroni:
  dynamicConfiguration:
    postgresql:
      parameters:
        shared_preload_libraries: pg_tde
After updating the configuration, apply it and restart your PostgreSQL pods:
kubectl apply -f deploy/cr.yaml

for sts in $(kubectl get statefulset -o name | grep cluster1-instance1); do
    kubectl rollout restart $sts
done
Note: Attempting to enable pg_tde without properly configuring shared_preload_libraries will result in an error indicating that pg_tde can only be loaded at server startup.
While pg_tde supports file-based key storage, it is recommended that production environments use a Key Management Service such as HashiCorp Vault or OpenBao to ensure secure key management.
Deploy Vault in your Kubernetes cluster:
helm repo add hashicorp https://helm.releases.hashicorp.com
helm install vault hashicorp/vault
  --disable-openapi-validation
  --version 0.16.1
  --namespace vault
  --set dataStorage.enabled=false
  --set global.logLevel=trace
  --set global.platform=kubernetes
After deploying Vault, we need to initialize it and obtain the root token. This process involves creating an initial set of encryption keys and unsealing the Vault instance:
kubectl exec -it vault-0 -- vault operator init
  -tls-skip-verify
  -key-shares=1
  -key-threshold=1
  -format=json >vault.json

unsealKey=$(jq -r ".unseal_keys_b64[]" <vault.json)
token=$(jq -r ".root_token" <vault.json)

kubectl exec -it vault-0 -- vault operator unseal -tls-skip-verify "$unsealKey"

kubectl exec -it vault-0 -- sh -c
  "export VAULT_TOKEN=$token &&
   export VAULT_LOG_LEVEL=trace &&
   vault secrets enable --version=1 -tls-skip-verify -path=secret kv"
Now, we can configure pg_tde to use Vault as the key provider:
SELECT pg_tde_add_key_provider_vault_v2(
  'vault-provider',
  '<rootToken>',
  'http://vault.vault.svc.cluster.local:8200',
  'secret',
  NULL
);

SELECT pg_tde_set_principal_key('tde-principal-key','vault-provider');
Percona Server for PostgreSQL offers two encryption methods:
When using Percona Server for PostgreSQL images, we can utilize the more comprehensive tde_heap method:
CREATE TABLE encrypted_data (
  id INTEGER GENERATED ALWAYS AS IDENTITY PRIMARY KEY,
  t text not null
) USING tde_heap;
Verify the encryption status of your table:
SELECT pg_tde_is_encrypted('encrypted_data');
For more detailed information about pg_tde capabilities and configurations, please refer to the official Percona documentation.
In the current release of Percona Operator for PostgreSQL, implementing pg_tde requires manual configuration steps as outlined above. Users need to explicitly configure shared libraries, set up key providers, and manage the encryption infrastructure themselves. This approach, while functional, requires careful attention to detail and a thorough understanding of both pg_tde and Kubernetes operations.
However, future releases of the Percona Operator will introduce seamless integration with pg_tde, significantly simplifying the encryption implementation process. The operator will handle the underlying configuration automatically, allowing users to focus primarily on their database design. In these upcoming versions, enabling encryption will be as straightforward as creating tables with the tde_heap access method while the operator manages all the necessary infrastructure and configuration behind the scenes.
Managing database users and their passwords can be a hassle. Sometimes, they could even wait in various configuration files, hardcoded. Using certificates can help you avoid the toil of managing, rotating, and securing user passwords, so let’s see how to have x509 certificate authentication with the Percona Server for MongoDB Operator and cert-manager.
cert-manager is our recommended way to manage TLS certificates on Kubernetes clusters. The operator is already integrated with it to generate certificates for TLS and cluster member authentication. We’re going to leverage cert-manager APIs to generate valid certificates for MongoDB clients.
There are rules to follow to have a valid certificate for user authentication:
For the complete requirements, check the MongoDB docs.
Let’s check our current certificates:
$ kubectl get cert
NAME                      READY   SECRET                    AGE
cluster1-ssl              True    cluster1-ssl              17h
cluster1-ssl-internal     True    cluster1-ssl-internal     17h
The operator configures MongoDB nodes to use “cluster1-ssl-internal” as the certificate authority. We’re going to use it to sign the client certificates to conform to Rule 1.
First, we need to create an Issuer:
$ kubectl apply -f - <<EOF
apiVersion: cert-manager.io/v1
kind: Issuer
metadata:
 name: cluster1-psmdb-x509-ca
spec:
 ca:
   secretName: cluster1-ssl-internal
EOF
Then, our certificate:
$ kubectl apply -f - <<EOF
apiVersion: cert-manager.io/v1
kind: Certificate
metadata:
 name: cluster1-psmdb-egegunes
spec:
 secretName: cluster1-psmdb-egegunes
 isCA: false
 commonName: egegunes
 subject:
   organizations:
     - percona
   organizationalUnits:
     - cloud
 usages:
   - digital signature
   - client auth
 issuerRef:
   name: cluster1-psmdb-x509-ca
   kind: Issuer
   group: cert-manager.io
EOF
The “usages” field is important. You shouldn’t touch its values. You can change the “subject” and “commonName” fields as you wish. They’re going to construct the Distinguished Name (DN) and DN will be the username.
$ kubectl get secret cluster1-psmdb-egegunes -o yaml \
    | yq3 r - 'data."tls.crt"' \
    | base64 -d \
    | openssl x509 -subject -noout

subject=O = percona, OU = cloud, CN = egegunes
Let’s create the user:
rs0:PRIMARY> db.getSiblingDB("$external").runCommand(
 {
   createUser: "CN=egegunes,OU=cloud,O=percona",
   roles: [{ role: 'readWrite', db: 'test' }]
 }
)

{
       "ok" : 1,
       "$clusterTime" : {
               "clusterTime" : Timestamp(1643099623, 3),
               "signature" : {
                       "hash" : BinData(0,"EdPrmPJqfgRpMEZwGMeKNLdCe10="),
                       "keyId" : NumberLong("7056790236952526853")
               }
       },
       "operationTime" : Timestamp(1643099623, 3)
}
We’re creating the user in the “$external” database. You need to use “$external” as your authentication source. Note that we’re reversing the subject fields, this is important.
I have created a simple Go application to show how you can use x509 certificates to authenticate. It’s redacted here for brevity:
// ca.crt is mounted from secret/cluster1-ssl
caFilePath := "/etc/mongodb-ssl/ca.crt"

// tls.pem consists of tls.key and tls.crt, they're mounted from
secret/cluster1-psmdb-egegunes
certKeyFilePath := "/tmp/tls.pem"

endpoint := "cluster1-rs0.psmdb.svc.cluster.local"

uri := fmt.Sprintf(
       "mongodb+srv://%s/?tlsCAFile=%s&tlsCertificateKeyFile=%s",
       endpoint,
       caFilePath,
       certKeyFilePath,
)

credential := options.Credential{
       AuthMechanism: "MONGODB-X509",
       AuthSource:    "$external",
}

opts := options.Client().SetAuth(credential).ApplyURI(uri)

client, _ := mongo.Connect(ctx, opts)
The important part is using “MONGODB-X509” as the authentication mechanism. We also need to pass the CA and client certificate in the MongoDB URI.
$ kubectl logs psmdb-x509-tester-688c989567-rmgxv
2022/01/25 07:50:09 Connecting to database
2022/01/25 07:50:09 URI: mongodb+srv://cluster1-rs0.psmdb.svc.cluster.local/?tlsCAFile=/etc/mongodb-ssl/ca.crt&tlsCertificateKeyFile=/tmp/tls.pem
2022/01/25 07:50:09 Username: O=percona,OU=cloud,CN=egegunes
2022/01/25 07:50:09 Connected to database
2022/01/25 07:50:09 Successful ping
You can see the complete example in this repository. If you have any questions, please add a comment or create a topic in the Percona Forums.
This is a joint post with Sergey Pronin.
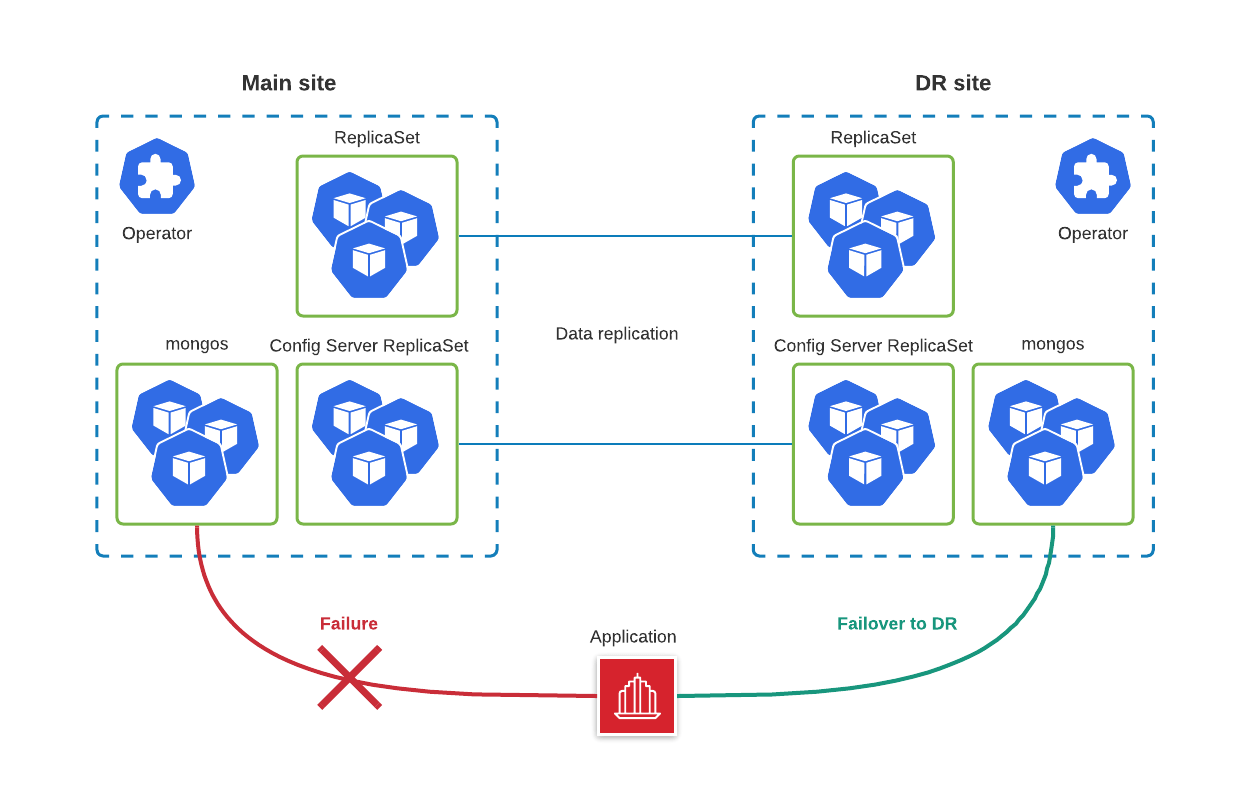
As per the glossary, Disaster Recovery (DR) protocols are an organization’s method of regaining access and functionality to its IT infrastructure in events like a natural disaster, cyber attack, or even business disruptions related to the COVID-19 pandemic. When we talk about data, storing backups on remote servers is enough to pass DR compliance checks for some companies. But for others, Recovery Time Objectives (RTO) and Recovery Point Objectives (RPO) are extremely tight and require more than just a backup/restore procedure.
In this blog post, we are going to show you how to set up MongoDB on two distant Kubernetes clusters with Percona Distribution for MongoDB Operator to meet the toughest DR requirements.
Here is what we are going to do:
In the 1.10.0 version of the Operator, we have added the Technology Preview of the new feature which enables users to deploy unmanaged MongoDB nodes and connect them to existing Replica Sets.
We are not going to cover the configuration of the Kubernetes clusters, but in our tests, we relied on two Google Kubernetes Engine (GKE) clusters deployed in different regions.
We have shared all the resources for this blog post in this GitHub repo. As a first step we are going to deploy the operator on the Main site:
$ kubectl apply -f bundle.yaml
Deploy the MongoDB managed cluster with cr-main.yaml:
$ kubectl apply -f cr-main.yaml
It is important to understand that we will need to expose ReplicaSet nodes through a dedicated service. This includes Config Servers. This is required to ensure that ReplicaSet nodes on Main and DR can reach each other. So it is like a full mesh:
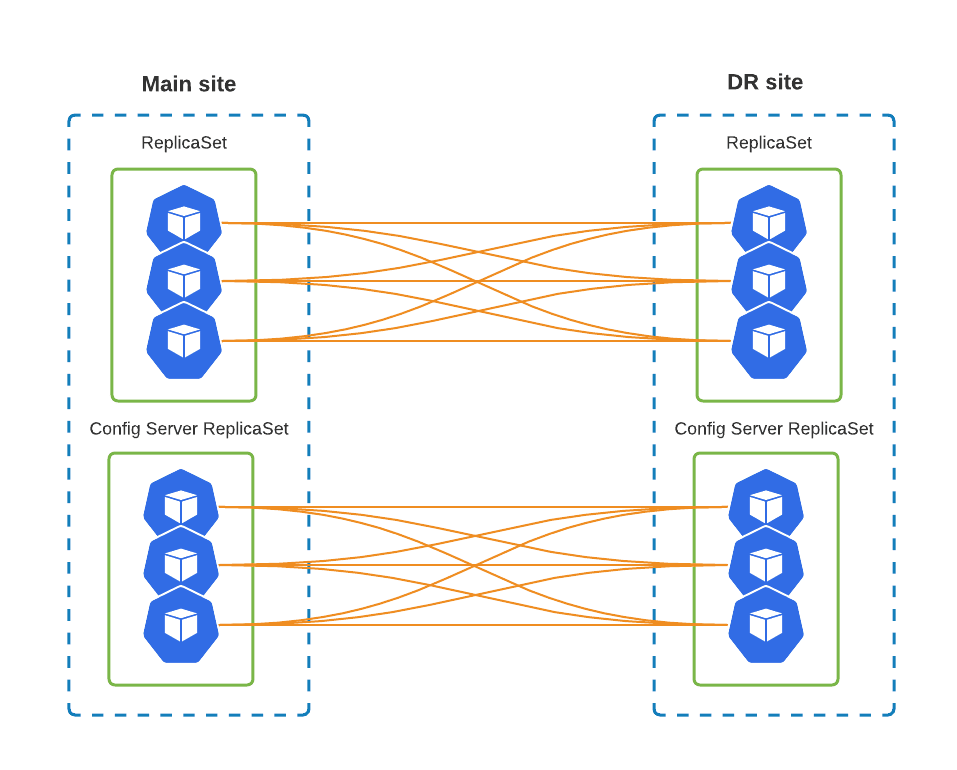
To get there, cr-main.yaml has the following changes:
spec:
  replsets:
  - rs0:
    expose:
      enabled: true
      exposeType: LoadBalancer
  sharding:
    configsvrReplSet:
      expose:
        enabled: true
        exposeType: LoadBalancer
We are using the LoadBalancer Kubernetes Service object as it is just simpler for us, but there are other options – ClusterIP, NodePort. It is also possible to utilize 3rd party tools like Submariner to implement a private connection.
If you have an already running MongoDB cluster in Kubernetes, you can expose the ReplicaSets without downtime by changing these variables.
The configuration of the Disaster Recovery site could be broken down into the following steps:
System user’s credentials are stored by default in my-cluster-name-secrets Secret object and defined in spec.secrets.users. Apply this secret in the DR cluster with kubectl apply -f yaml-with-secrets. If you don’t have it in your source code repository or if you rely on the Operator to generate it, you can get the secret from Kubernetes itself, remove the unnecessary metadata and apply.
On main execute:
$ kubectl get secret my-cluster-name-secrets -o yaml > my-cluster-secrets.yaml
Now remove the following lines from metadata:
annotations
creationTimestamp
resourceVersion
selfLink
uid
Save the file and apply it to the DR cluster.
The procedure to copy SSL keys is almost the same as for users. The difference is the names of the Secret objects – they are usually called <CLUSTER_NAME>-ssl and <CLUSTER_NAME>-ssl-internal. It is also possible to specify them in secrets.ssl and secrets.sslInternal in the Custom Resource. Copy these two keys from Main to DR and reference them in the CR.
cr-replica.yaml will have the following changes:
  secrets:
    users: my-cluster-name-secrets
    ssl: replica-cluster-ssl
    sslInternal: replica-cluster-ssl-internal

  replsets:
  - name: rs0
    size: 3
    expose:
      enabled: true
      exposeType: LoadBalancer

  sharding:
    enabled: true
    configsvrReplSet:
      size: 3
      expose:
        enabled: true
        exposeType: LoadBalancer

  backup:
    enabled: false
Once the Custom Resource is applied, the services are going to be created. We will need the IP addresses of each ReplicaSet node to configure the DR site.
$ kubectl get services
NAME                  TYPE           CLUSTER-IP      EXTERNAL-IP      PORT(S)           AGE
replica-cluster-cfg-0    LoadBalancer   10.111.241.213   34.78.119.1       27017:31083/TCP   5m28s
replica-cluster-cfg-1    LoadBalancer   10.111.243.70    35.195.138.253    27017:31957/TCP   4m52s
replica-cluster-cfg-2    LoadBalancer   10.111.246.94    146.148.113.165   27017:30196/TCP   4m6s
...
replica-cluster-rs0-0    LoadBalancer   10.111.241.41    34.79.64.213      27017:31993/TCP   5m28s
replica-cluster-rs0-1    LoadBalancer   10.111.242.158   34.76.238.149     27017:32012/TCP   4m47s
replica-cluster-rs0-2    LoadBalancer   10.111.242.191   35.195.253.107    27017:31209/TCP   4m22s
At this step, we are going to add unmanaged nodes to the Replica Set on the Main site. In cr-main.yaml we should add externalNodes under replsets.[] and sharding.configsvrReplSet:
  replsets:
  - name: rs0
    externalNodes:
    - host: 34.79.64.213
      priority: 1
      votes: 1
    - host: 34.76.238.149
      priority: 1
      votes: 1
    - host: 35.195.253.107
      priority: 0
      votes: 0

  sharding:
    configsvrReplSet:
      externalNodes:
      - host: 34.78.119.1
        priority: 1
        votes: 1
      - host: 35.195.138.253
        priority: 1
        votes: 1
      - host: 146.148.113.165
        priority: 0
        votes: 0
Please note that we add three nodes, but only two are voters. We do this to avoid split-brain situations and do not start the primary election if the DR site is down or there is a network disruption between the Main and DR sites.
Once all the configuration above is applied, the situation will look like this:
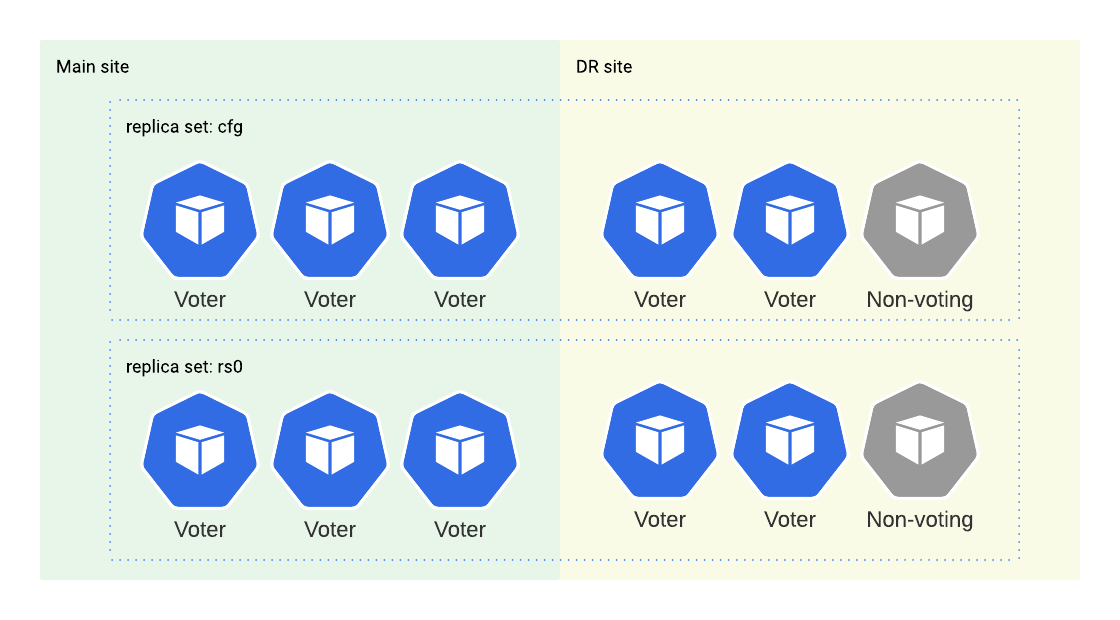
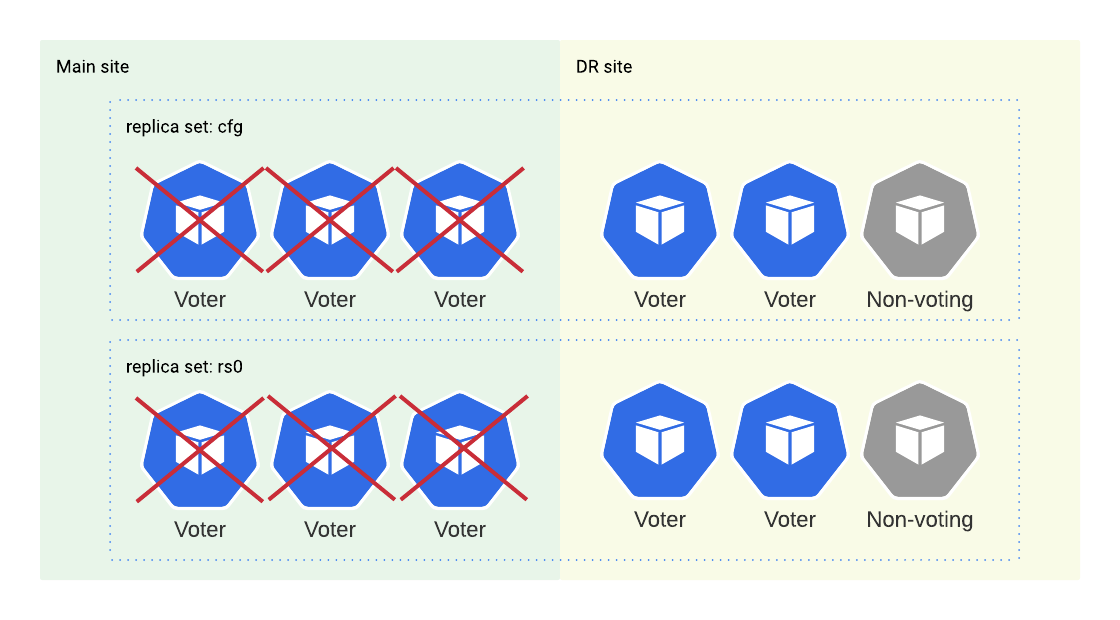
We have three voters in the main cluster and two voters in the replica cluster. That means replica nodes won’t have the majority in case of main cluster failure and they won’t be able to elect a new primary. Therefore we need to step in and perform a manual failover.
Let’s kill the main cluster:
gcloud compute instances list \
    | grep my-main-gke-demo \
    | awk '{print $1}' \
    | xargs gcloud compute instances delete --zone europe-west3-b

gcloud container node-pools delete \
    --zone europe-west3-b \
    --cluster my-main-gke-demo \
    default-pool
I deleted the nodes and the node pool of the main Kubernetes cluster so now the cluster is in an unhealthy state. Let’s see what mongos on the DR site says when we try to read or write through it:
% ./psmdb-tester
2021/09/03 18:19:19 Successfully connected and pinged 34.141.3.189:27017
2021/09/03 18:19:40 read failed: (FailedToSatisfyReadPreference) Encountered non-retryable error during query :: caused by :: Could not find host matching read preference { mode: "primary" } for set cfg
2021/09/03 18:19:49 write failed: (FailedToSatisfyReadPreference) Could not find host matching read preference { mode: "primary" } for set cfg
Normally, we can only alter the replica set configuration from the primary node but in this kind of situation where you don’t have a primary and only have a few surviving members, MongoDB allows us to force the reconfiguration from any alive member.
Let’s connect to one of the secondary nodes in the replica cluster and perform the failover:
kubectl exec -it psmdb-client-7b9f978649-pjb2k -- mongo 'mongodb://clusterAdmin:<pass>@replica-cluster-rs0-0.replica.svc.cluster.local/admin?ssl=false'
...
rs0:SECONDARY> cfg = rs.config()
rs0:SECONDARY> cfg.members = [cfg.members[3], cfg.members[4], cfg.members[5]]
rs0:SECONDARY> rs.reconfig(cfg, {force: true})
Note that the indexes of surviving members may differ in your environment. You should check rs.status() and rs.config() outputs first. The main idea is to repopulate config members with only surviving members.
After the reconfiguration, the replica set will have just three members and two of them will have votes and a majority. So, they’ll be able to select a new primary. After performing the same process on the cfg replica set, we will be able to read and write through mongos again:
% ./psmdb-tester
2021/09/03 18:41:48 Successfully connected and pinged 34.141.3.189:27017
2021/09/03 18:41:49 read succeed
2021/09/03 18:41:50 read succeed
2021/09/03 18:41:51 read succeed
2021/09/03 18:41:52 read succeed
2021/09/03 18:41:53 read succeed
2021/09/03 18:41:54 read succeed
2021/09/03 18:41:55 read succeed
2021/09/03 18:41:56 read succeed
2021/09/03 18:41:57 read succeed
2021/09/03 18:41:58 read succeed
2021/09/03 18:41:58 write succeed
Once the replica cluster has become the primary, you should reconfigure all clients that connect to the old main cluster and point them to the DR site.